Occassional thoughts about orienteering
| okansas.blogspot.com Occassional thoughts about orienteering |
|
Monday, July 16, 2012 SPROUT overviewTrying to predict US team results at the WOC was an experiment. In part, I wanted to see if a really simple model would work. In part, I'm always interested in ways of thinking about how a team is doing and trying to understand if a race is "good" or "bad."SPROUT predicts the place of each US runner in each WOC qualifying race. After 17 results, I think SPROUT worked pretty well: 4 times the prediction and the actual results matched 3 times the prediction and the actual results were 1 place apart 3 times the prediction and the actual results were 2 places apart 3 times the prediction and the actual results were 3 places apart So, of 13 of 17 results were within 3 places. The median difference was 2 places. The worst prediction was off by 10 places. Ali Croker's sprint qualifying result was much better than SPROUT expected. The graph shows the difference between SPROUT and actual results. You can see that the difference clusters around 2, with two outliers. 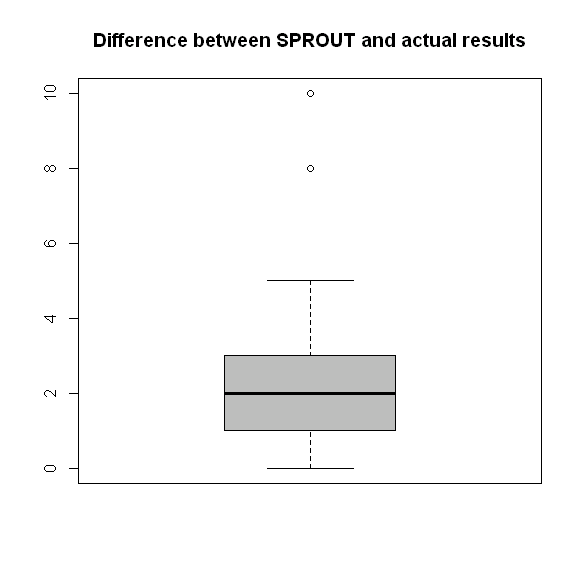 SPROUT is incredibly simple. All it takes are a ranked list of the runners on the team (I used WRE points to put the runners in order) and a "normal US place" and a number to add to or subtract from the normal US place. I think a small tweak - looking at the actual values of the ranking list, not just the order - might have improved SPROUT a little bit. Back to okansas.blogspot.com. posted by Michael | 7:39 PM
Comments:
Very interesting and remarkably good!
I challenge you to predict the relay results of the peer nations with SPROUT. Is there a chance that this works too?
I think an even simpler system might work for relays. I'll take a look and come up with some predictions.
Michael # posted by
 : 7:07 AM : 7:07 AM
Hi! Now I am very curious about the SPROUT analysis. :) Is that a formal method? The plots remind me of R plots. Which software have you used? :) I hope I am not asking too much! Thanks!
Duska # posted by
: 2:44 PM
Just noticed Duska's comment.
Post a Comment
I would say that it is a formal method, but it is very simple. It is described in a bit more detail here: http://okansas.blogspot.com/2012/07/looking-ahead-to-tomorrow.html And I am using R for the plots. Michael # posted by
: 10:26 AM |
|
||||
|
|
|||||